Australia is changing. What counts as a fancy suburb? That has changed too. Parts of Australia that were once struggling now have Range Rovers in the driveways.
We have great insight into this question at the moment because the Australian Tax Office has just released its taxation statistics, showing how much taxable income people in each postcode report. It has also released a bunch of historical data that permits us to compare the most recent year with past years, back to 2003-04. The places with the top taxable incomes are in the 100th percentile, while the places with the lowest are in the 1st percentile. We can find places that were at the bottom end of the scale in 2003-04 but have shot up since.
For the most extreme example of what I’m talking about, consider the area around Springsure in Queensland — postcode 4722, including Orion, Cona Creek, Buckland, etc. This was once a pretty depressed area, with median taxable incomes in the 21st percentile. That means about 80% of Australia was making more money than Springsure. But now? In the 2019-20 data, the area has changed completely. It is now in the 89th percentile, meaning it is richer than almost 90% of Australia.
The area grows mungbeans and mandarins, but the real magic is much deeper underground. Springsure is near the Bowen Basin, Queensland’s big coal deposit, and a lot of the money landing in local pockets comes from global energy markets.
But let’s focus our attention on the cities, where some of the more interesting moves are found. Take postcode 5000: Adelaide. It has done almost the exact opposite, slipping from the 89th percentile, one of the richest areas in Australia, to the 20th percentile, one of the poorest. What’s the reason? In this case, it’s about new developments bringing in young people. The population of postcode 5000 has almost doubled over the period, as Adelaide builds apartments, and that has changed the composition of the area dramatically.
In the cities, sharp moves downward in median income are not that uncommon — they seem to happen in areas where apartments have gone up. But sharp moves upwards are rare. Suburbs need to grind away to get richer, and those that do were often in the top half to start with.
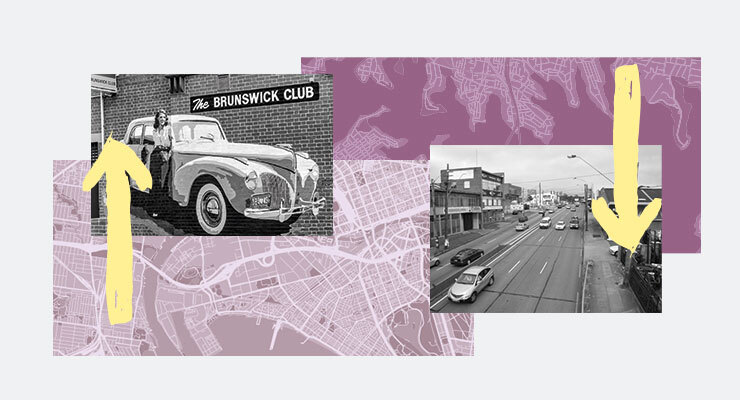
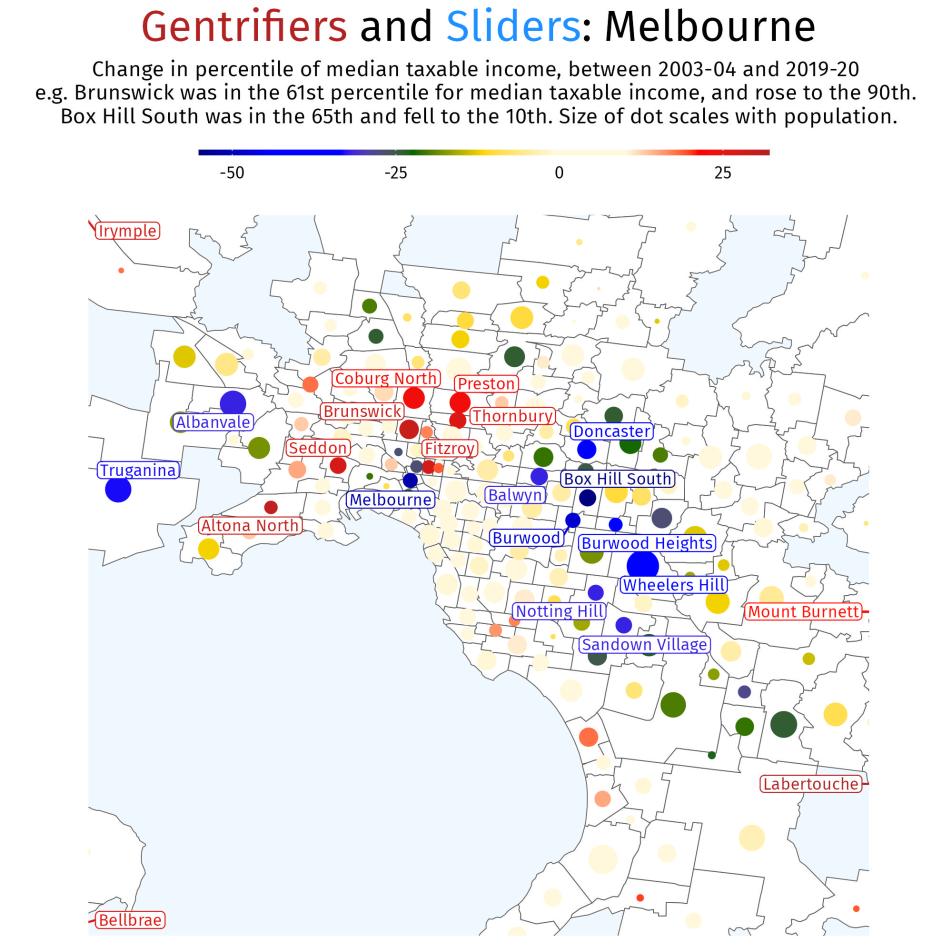
Look at this map of Melbourne. A ring of suburbs in the east has seen a big fall in median income. That is explained — in some cases — by the rise of apartment towers bringing in new, younger residents, especially students. While the inner east is stable, the inner north and inner west have risen. These suburbs were once derided, then became fashionable, and are now full of families in their income-earning prime. Chainlink fences are being replaced with pickets and where the Commodore was once parked there are now rosebushes. But that doesn’t mean disadvantage has gone from those suburbs.
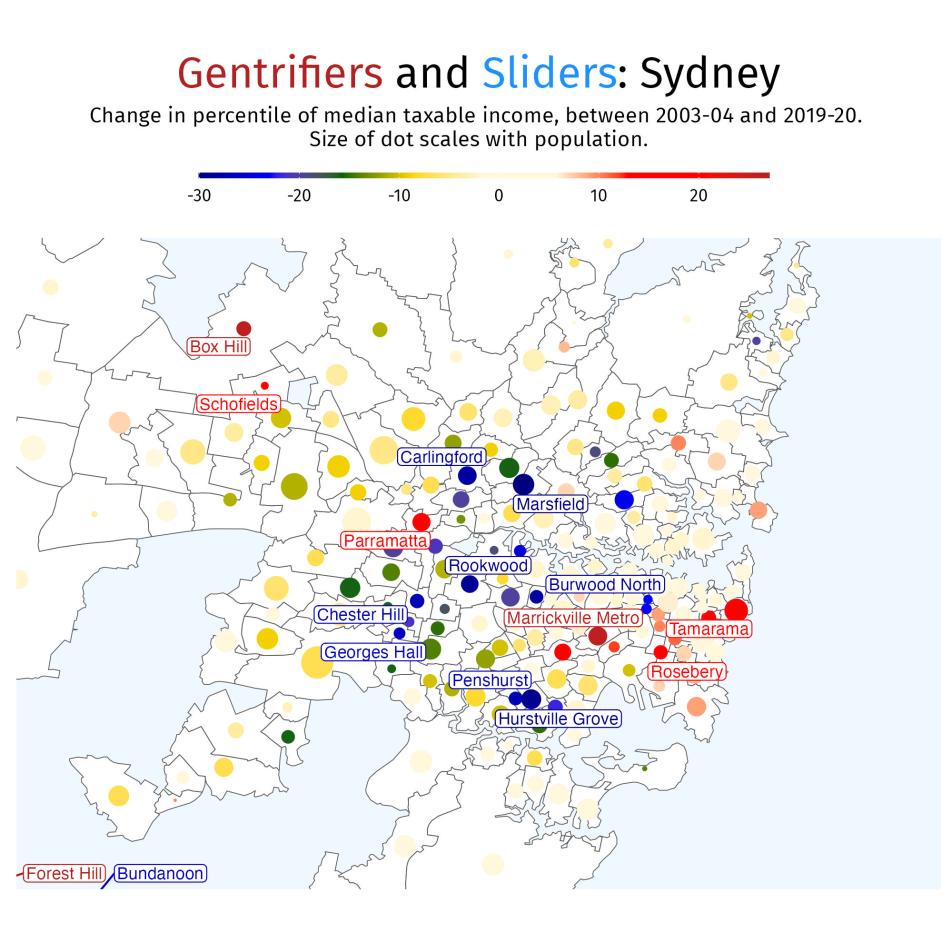
Sydney shows a somewhat similar pattern: stable on the north shore, once-unfashionable suburbs like Marrickville and Parramatta rising, while the big falls are in the middle ring. Please note: a postcode can encompass more than one suburb name, but the labels on the map include only one of the suburbs in that postcode.
All postcodes in Australia have become richer since 2003-04, but for a rich country like ours, wealth is usually relative. People living in suburbs that are climbing the pecking order may well feel satisfied with their choice, while those living in the falling zones may be disappointed.
Remember, though, that just because the median income of an area may drop, doesn’t mean the existing residents are made worse off. Having more locals in an area can often lead to an influx of cafes, shops and restaurants. Living in a large house in Box Hill is arguable now even nicer than it was before the changes.
Do you feel your area is on the rise or the decline? What are the signs you’ve noticed? Let us know your thoughts by writing to letters@crikey.com.au. Please include your full name to be considered for publication. We reserve the right to edit for length and clarity.


No one lives in Nadia, South Australia